
Fig 1a. Ideal optical system brings all colours in white light to the same focal point.

Fig 1b. The ideally-focused white squares on the black background are sharp and have no colour fringes.
Use this web page to simulate/explore longitudinal and lateral (a.k.a 'axial and transverse') chromatic aberration, a category of optical focus defects involving 'colour fringes' and bluriness.
Detailed how-to info is lower on this page. To try it right now, drag the focus slider to adjust focus, drag the curves or press a 'preset' button to change the 'optical parameters', or press a radio button to change the image. Lateral chromatic aberration can be linked with longitudinal, or controlled directly. (The simulator works best with a mouse; touch-dragging might be fussy on some devices.)
An ideal camera or microscope focuses all colours within white light identically, with the same magnification, as in figure 1 (many of the images in figures below were generated by the simulator above, using the 'squares' image; use the simulator to see the figure images full size and to explore them dynamically):
Fig 1a. Ideal optical system brings all colours in white light to the same focal point.
Fig 1b. The ideally-focused white squares on the black background are sharp and have no colour fringes.
Lateral ('transverse') chromatic aberration occurs when the image magnification depends upon the light colour, as in figure 2. Here, all the colours are in focus but the blue part of the image is larger than the green, which is larger than the red. The three images align at the optical axis, but increasingly diverge with distance from the optical axis, giving rise to 'colour fringes' especially at the frame edges.

Fig 2a. Lateral chromatic aberration, where image magnification varies with light colour, resulting in 'colour fringes'.

Fig 2b. The squares have colour fringes that are increasingly severe with distance from the center.
Software in digital cameras can somewhat compensate for lateral chromatic aberration by resizing the images in each colour channel to make their magnifications align better.
An optical system suffering from longitudinal ('axial') chromatic aberration has focal lengths that vary depending upon the light colour. In figure 3, the red, green, and blue colours separate, and only green is in focus. Out-of-focus colours spread into adjacent areas, creating false colours.

Fig 3a. Longitudinal chromatic aberration, where focal distance varies with light colour (eg., here, only green is in focus).

Fig 3b. Out-of-focus colours spread into adjacent areas. Only green is in focus; red and blue bleed into the adjacent black, leaving more green at the edges of the squares.
The amount of blur created by longitudinal chromatic aberration ('LoCa') can be reduced by using just the central portion of the lens, eg., by making the aperture smaller, increasing the depth of field. The LoCA is still present but is less severe, sharpening the image.
If the optical system's best-focus surface is curved and the image plane (eg., camera sensor) is flat, the mismatch causes radially-dependent differences in best focus distance and thus chromatic aberration due to longitudinal CA may also vary radially.
Chromatic aberration can be reduced by lens design. An 'achromatic' lens design tries to bring two colours, usually red and blue, to the same foci. An 'apochromatic' lens design brings three colours into the same focus, and usually has less focus error of colours in between.
The longitudinal chromatic aberration (LoCA) and focusing ability of an optical system can be measured by observing how well it can render a sharp edge, as described at Focus Analyser: Creating and analysing the image of an inclined edge. Poorer focus causes the edge image to be spread over more pixels.
Figure 4 is a chart of the measured edge spread for each colour channel of an edge photographed through a stereomicroscope, as a function of focus distance, ie., the horizontal axis is distance from the lens, and the vertical axis is the size of the edge spread; lower is better/shaper:

Fig 4. Edge spread chart for a stereomicroscope, produced by Focus Analyser (from the analysis of that stereomicroscope).

Fig 5. A video of the view through a stereomicroscope, looking at a laser-printed half-tone pattern, as the focus knob is turned back and forth. Chromatic aberration causes the black & white image to have a greenish cast at one side of best focus, and bluish at the other side.
Light of each of the three colours comes to best focus at the distance corresponding to the lowest point on their curve (ie., minimum edge spread). Thus, figure 4 says that the stereomicroscope focuses green and red light best, at a distance closer than the best distance for blue. Red and green come to best focus at roughly the same distance; blue's best focus distance is a somewhat further, and even at its best focus distance, blue is not as sharp as red and green. Blue's best focus is higher on the vertical axis (indicating greater edge spread) than red or green's best focus due to optical issues other than longitudinal chromatic aberration.
(Press the 'stereomicroscope' button of the simulator to load focus curves similar to figure 4.)
Figure 5, above, is a video recorded through a stereomicroscope when viewing a black & white object (a laser-printed half-tone pattern), during which the focus was raised and lowered across the point of best focus. Chromatic aberration causes the blurred image at either side of the focus range to be greenish on one side of best focus, and bluish on the other side. Such 'false colour' when defocused is indicative of chromatic aberration (explore it using the simulator).
Figure 6 shows the edge spread measurements for another optical system, a macro lens mounted on a DSLR camera:
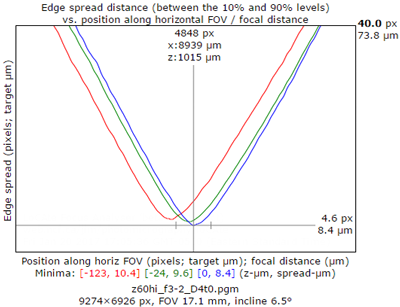
Fig 6. Edge spread chart for a DSLR macro lens, produced by Focus Analyser (from the analysis of that macro lens).
(Press the 'macro lens' button of the simulator to load focus curves similar to figure 6.)
The curves in the simulator's left panel control the blur of each colour channel as a function of focus distance. Drag the curves sideways or vertically on the chart to move the curve for the colour of the highlighted button (press a R, B, or G button to make curve-dragging change that colour). The horizontal position of the curves affects longitudinal chromatic aberration, and the vertical position adds a 'baseline' defocus. The 'preset' buttons set the curves to simulate various optical systems.
Lateral aberration can be specified using sliders, or linked to longitudinal aberration (longitudinal chromatic aberration can cause fringing proportional to off-axis radical distance due to the center of a ray's 'blur' ellipse being further out radially than the associated ray axis).
Drag the focus slider to change focus. As the slider moves, the simulator will render the image according to the curves and settings.
The target image can be selected using the 'Images' radio buttons. 'Colour bars' is a good target for exploring how blurring affects colour 'bleeding'.
The simulation is intended to provide just a general, subjective feel for the effects of chromatic aberration, drawing upon image processing facilities built into browsers. To read about more sophisticated simulation, have a look at Frans van den Bergh's blog articles on simulating diffraction and simulating defocus and spherical aberration.

Chromatic Aberration Simulator by Jim Elder is licensed under a Creative Commons Attribution-NonCommercial-ShareAlike 4.0 International License.
Citation info:
Chromatic Aberration Simulator (2019-Jul)
smallpond.ca/jim/photomicrography/ca
Jim Elder, Ottawa, Canada