
Fig 1. Wild M8 stereomicroscope
Fig 1. Wild M8 stereomicroscope
This CMO-design trinocular stereomicroscope was paired with a Canon EOS 1DS camera via a 10x photo ocular and a 0.32x relay lens.
As per the Focus Analyser procedure, the test target for these analyses was a carbon-soot-coated straight-edge razor blade inclined (with respect to the optical axis) by 17.1° and tilted (with respect to the camera frame) by ~6°, elevated about 5mm above an out-of-focus white paper background. The target was illuminated obliquely by fiber optic illuminators. The camera's white balance was set to 3200°K. Raw files were processed with dcraw ('-D -4 -t 0') to produce PGM files used by Focus Analyser.
This analysis is based upon photomicrographs contributed by the owner of Wild M8 equipment (figure 1). It has a Wild-Heerbrugg (WH) Plan 1x objective. The phototube is WH 376788, with an inner diameter of 38mm. The phototube is compatible with the Leitz Periplan TL 160mm sleeve which houses a Leitz Wetzlar 10x photo ocular (part number 519749). The spacer tube is WH 404207 in which jacket WH 162226 fits. It carries the WH 370759 0.32x relay lens.
Below are Focus Analyser reports for selected zoom settings from the stereomicroscope's range. The field of view (FOV) for each analysis was determined by taking a photo of a scale positioned perpendicular to the optical axis, at each zoom level.
Ideally, the microscope + camera adapter would focus all three colours identically; the curves would overlap.
Toward maximum zoom, longitudinal aberration develops and the resolution of the channels begins to vary, with green being best-focused and blue least.
Depth of field can be assessed by comparing the broadness of the curves with the two grey tick marks that indicate plus/minus 100 μm of z-axis change.
Figure 3 below charts edge spread vs zoom level, in terms of pixels (blue) and microns, for the green channel.
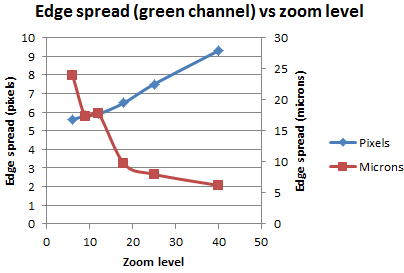
Fig 3. Focus Analyser edge spread vs microscope zoom level, in terms of pixels (blue) and microns (red).
Figure 4 below charts focus distance vs zoom level for the green channel, where 'focus distance' is the location of the best-focus along the frame, in percentage terms, for the green channel. Since the target is inclined (higher on the left), the best-focus point moves left or right if it is closer or further. If the optical system were parfocal, the focus distance would not vary with zoom level. The variation means the microscope camera would need to be re-focused after changing the zoom level.
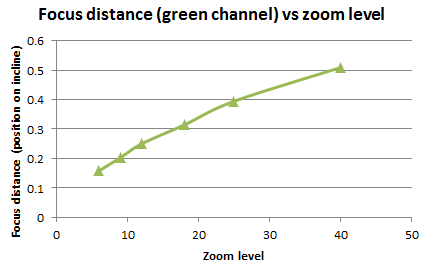
Fig 4. Focus position within frame (percent of distance, from left) vs microscope zoom level. This would be constant if the system were parfocal. (In essence, this curve reports how the point of best focus, for the green channel, moves left-right with zoom level, as seen in the six Focus Analyser results above.)